
Here’s an inside look at how the LikeFolio Earnings Score helps investors spot momentum and make informed trades…
During the 1980 Olympics, the U.S. hockey team pulled out a “Miracle on Ice” to bring home the gold against all odds.
They were outshot 39-16 and down 3-2. The game was all but decided. Until something changed – and the U.S. team rallied in the third period to win 4-3 over the Soviet Union.
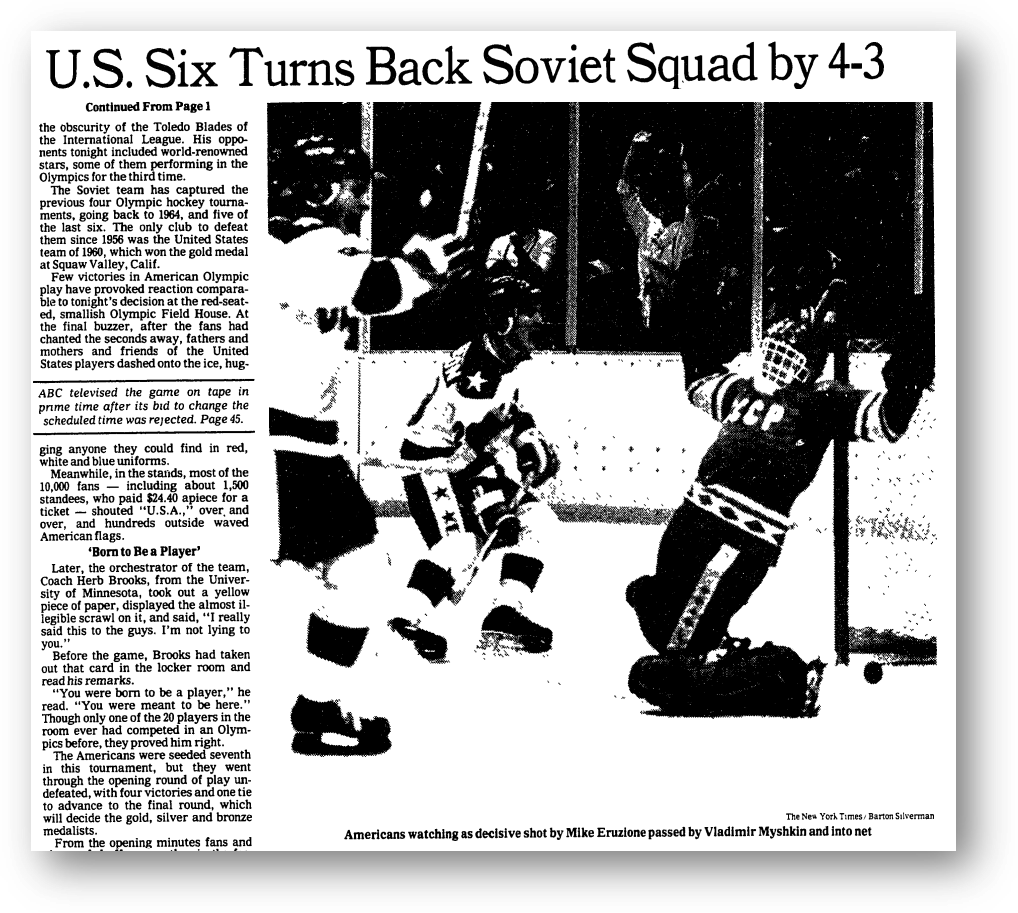
As team captain Mike Eruzione described the victory, “Once we got momentum, we just kept rolling. It’s like a snowball effect.”
Turns out, that “miracle” was actually momentum.
The noise level of the crowd rises, your heart races, beads of sweat form on your forehead, and your legs bounce you out of your seat.
Momentum is palpable – and powerful enough to completely alter an outcome.
Now, imagine you could apply that same type of momentum to investing and trading – to see the energy unfolding in real time, positive or negative, for publicly traded companies…
And leverage that momentum to make winning trades.
Well, you don’t have to imagine: Our social media machine was designed to measure changes in key consumer metrics like buzz, demand, and sentiment, to quantify company-level momentum.
Researchers at Georgetown University referred to this as the “unexpected component of sales growth” when they confirmed the efficacy of our system.
During earnings season, investors can spot momentum and make informed trades by referencing a company’s Earnings Score, which is LikeFolio’s proprietary consumer momentum indicator.
It tells us how bullish or bearish we are for a given company’s earnings reaction. The higher the score, the more bullish the outlook; the lower the score, the more bearish the outlook.
This method is simple, quantifiable, and increasingly predictive.
Here’s how it works…
The LikeFolio Earnings Score Explained
The LikeFolio Earnings Score is calculated from an ever-evolving equation that uses several inputs:
- Consumer mentions growth and rate of change
- Consumer demand growth and rate of change
- Consumer sentiment and change over time
- Supporting macro trend growth and rate of change
- Custom company or brand-specific metrics and their growth or change over time
- Stock price performance as an indicator of investor expectations
We also factor in how predictive these metrics have been in the past for each specific company, meaning each Earnings Score is carefully calibrated and fine-tuned to lean on the most predictive metrics we’re tracking. Powerful stuff.
Then, the results show us how bullish or bearish we are on a given company heading into earnings.
Scores will range from -100 to +100, with negative numbers being a bearish indication and positive numbers being a bullish indication.
The larger the number, the stronger the indication.
And the proof is in the profits…
How We Nabbed an 80% Win in Just One Day
Take a look at how our Earnings Score helped us bank a big win in just one day on Dick’s Sporting Goods (DKS) in November – because we’ll use it again and again for hundreds of trading opportunities during the 10 weeks of each upcoming earnings season.
The Setup
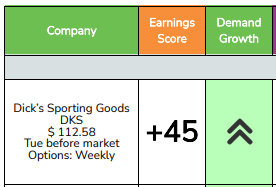
This particular trade setup hit during Week 6 of the Q4 season – just before Thanksgiving.
Our AI-powered consumer insights machine assigned DKS an Earnings Score of +45, telling us the stock could surprise to the upside.
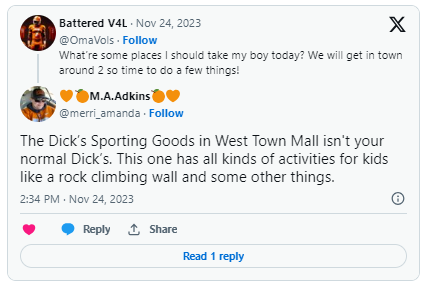
Dick’s Sporting Goods had recently opened a string of new “House of Sport” experience megastores, decked out with batting cages, rock walls, golf simulators – all sorts of hands-on areas where customers can demo products.

A deeper dive into our social data revealed they were generating renewed excitement from consumers.
In fact, LikeFolio data showed demand mentions for Dick’s hit a two-year high…
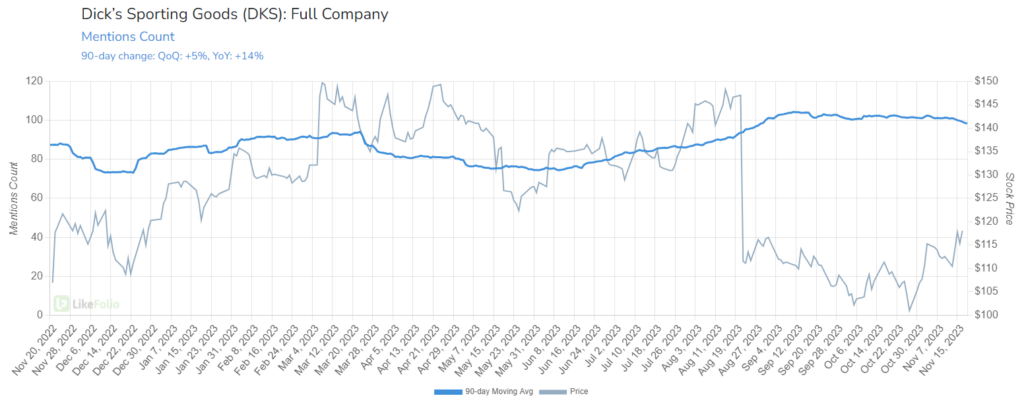
…while Consumer Happiness remained steady.
On the trend side of things, consumer interest in playing sports was (and still is) up, with pickleball mentions in particular gaining as much as 180% year-over-year. That worked in Dick’s favor.
Remember that our social media machine also takes into account investor expectations, and following Dick’s last earnings report, shares tanked over 24%, giving it a low bar to surpass.
All signs pointed to a bullish outcome…
The Result
So, on Monday, November 20, we leveraged one of our favorite trading strategies – one with a risk-reward ratio close to 50/50 that’s super simple to understand. Basically, you make money if the stock goes up and lose money if it goes down – but you cap your losses going in, so you always know what’s at stake.
The very next day, Dick’s issued an impressive earnings report, featuring a record $3.04 billion in sales for the third quarter with an updated full-year outlook.
It was the “best-case” scenario. DKS got a near-10% boost on the results, and we issued an early exit alert that netted investors an 80% profit.
The Takeaway
Our social media machine tipped us off that Dick’s was gaining momentum, and we used that to deliver our subscribers an 80% win virtually overnight.
That’s why it helps to have a real-time performance checker in your investing toolkit.
We’re gearing up for another action-packed 10 weeks of earnings to kick off this month.
And to get this profit party started in style, Landon teamed up with growth investor icon Louis Navellier to put on a special earnings event: The AI Earnings Predictor Summit.
The Summit is going down January 9, 2024, at 8:00 p.m. ET and we want to see all our Derby City Daily readers represented – so please join us to get in on the fun!
It won’t cost you anything to attend.
Just sign up using this link and we’ll see you there.
Until next time,

Andy Swan
Founder, LikeFolio
P.S. Ready for more earnings content? Don’t miss yesterday’s issue of Derby City Daily: The Investor’s Guide to Earnings Season (2024 Edition).