
During the 1980 Olympics, the U.S. hockey team pulled out a “Miracle on Ice” to bring home the gold against all odds.
They were outshot 39-16 and down 3-2. The game was all but decided. Until something changed – and the U.S. team rallied back in the third period to win 4-3 over the Soviet Union.
As team captain Mike Eruzione described the victory, “Once we got momentum, we just kept rolling. It’s like a snowball effect.”
Turns out, that “miracle” was actually momentum.
The noise level of the crowd rises, your heart races, beads of sweat form on your forehead, and your legs bounce you out of your seat.
Momentum is palpable – and powerful enough to completely alter an outcome.
Now, imagine you could apply that to investing and trading – to see the energy unfolding in real time, positive or negative, for publicly traded companies…
And leverage that momentum to make winning trades.
Well, you don’t have to imagine because you have LikeFolio in your corner.
Our social media machine was designed to measure changes in key consumer metrics like buzz, demand, and sentiment, to quantify company-level momentum.
Researchers at Georgetown University referred to this as the “unexpected component of sales growth” when they confirmed the efficacy of our system.
During earnings season, investors can spot momentum and make informed trades by referencing a company’s Earnings Score, which is LikeFolio’s proprietary consumer momentum indicator.
The higher the score, the more bullish the outlook; the lower the score, the more bearish the outlook.
This method is simple, quantifiable, and increasingly predictive.
And just one week into the 2023 Q2 earnings season, we’ve already used it to accurately predict the loss of momentum for two major companies…
The LikeFolio Earnings Score Explained
The LikeFolio Earnings Score is calculated from an ever-evolving equation that uses several inputs:
- Consumer Mentions growth and rate of change
- Consumer Purchase Intent (PI) growth and rate of change
- Consumer Happiness and change over time
- Supporting macro trend growth and rate of change
- Custom company or brand-specific metrics and their growth or change over time
- Stock price performance as an indicator of investor expectations
Then, the results show us how bullish or bearish we are on a given company heading into earnings.
Scores will range from -100 to +100, with negative numbers being a bearish indication and positive numbers being a bullish indication.
The larger the number, the stronger the indication.
And the proof is in the profits…
Take a look at how our Earnings Score helped us bank wins on Netflix (NFLX) and Tesla (TLSA) this week – because we’ll use it again and again over the next nine weeks of earnings season…
Netflix (NFLX) Shares Slide on Weak Subscriber Numbers
Our NFLX Earnings Score heading into this week’s report was –59, tipping us off that we should take a bearish stance on the stock.
LikeFolio was picking up big drops in new subscriber growth AND viewership mentions for Netflix:
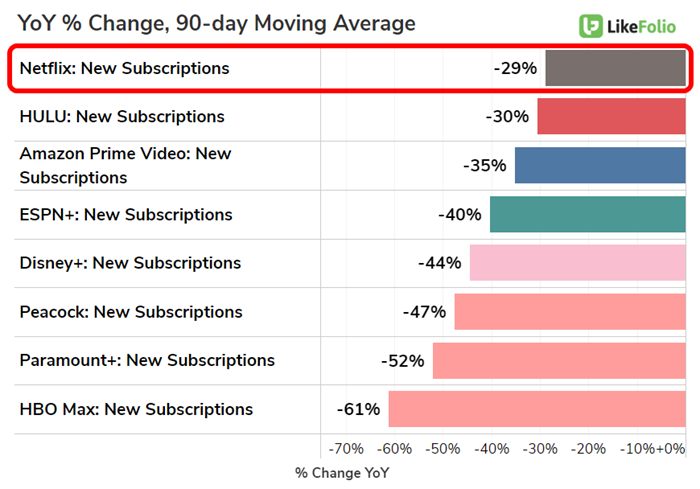
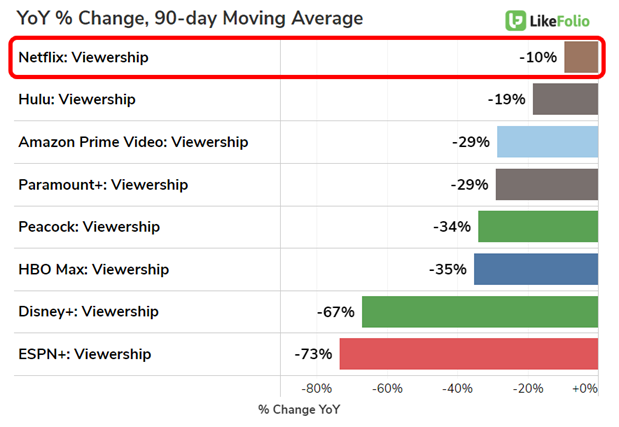
Our predictive consumer data indicated Netflix demand growth was losing momentum.
And we were right.
Netflix reported revenue of $8.16 billion, below estimates of $8.18 billion, while subscriber additions of 1.75 million came in lower than the 2.3 million expected.
The company also said it anticipates earnings of $2.84 per share on $8.24 billion in the second quarter, which was well below Wall Street forecasts of $3.05 per share on $8.5 billion in revenue.
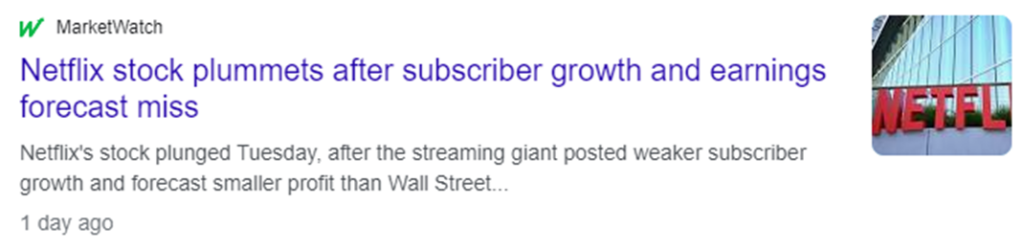
Netflix shares traded as much as 10% lower immediately following a disappointing earnings report.
And we nailed our earnings call on this stock once again.
As a Derby City Daily reader, you got early access to our NFLX earnings prediction. We hope you took full advantage.
Tesla (TSLA) Shares Sink on Margin Decline, Uncertain Outlook
Investors were tightly focused on Tesla price cuts ahead of the company’s 23Q1 earnings results – namely, how price cuts on its electric vehicles (EVs) would impact margins.
While LikeFolio data can’t speak to Tesla’s margins, it can speak to the number of consumers purchasing a Tesla vehicle.
And unfortunately for Tesla, demand appeared to be waning in the early days of the second quarter.
You can see this highlighted on the chart below:
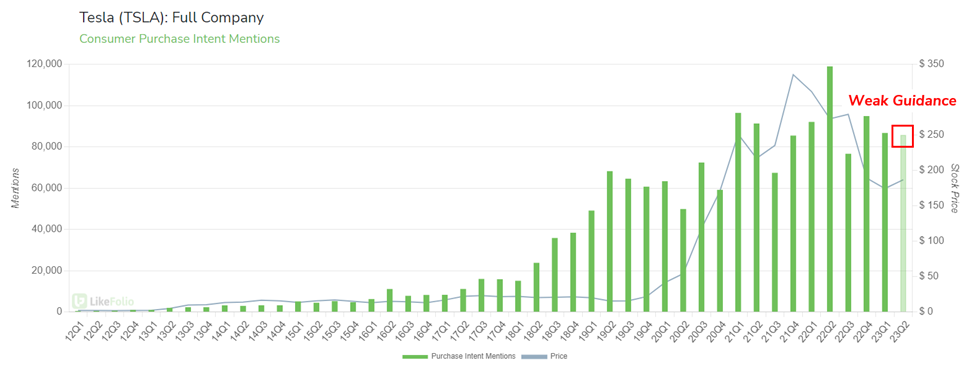
That slowdown in demand growth translated to our system giving TSLA a bearish Earnings Score of –42.
And on Wednesday, Tesla’s Q1 earnings report revealed margins were impacted by lower prices, with CEO Elon Musk noting that demand remained “uncertain.”
Shares sank following the earnings print, just like clockwork.

Looking ahead, high interest rates and economic “stormy weather” could mean consumers are more likely to postpone a large capital purchase… like a new car.
While we’re bullish on Tesla over the long term, LikeFolio’s early glimpse helped us predict bearish momentum in the near term. And we gave you a heads-up on Monday that volatility was incoming.
Netflix and Tesla are the resounding leaders of their respective industries. But even top players can have a bad game.
That’s why it helps to have a real-time performance checker in your investing toolkit.
We’re excited for the rest of the current earnings season to unfold with nine more action-packed weeks ahead of us.
Look out for a Week 2 earnings season sneak peek to hit your inbox tomorrow.
Let’s go!
Until next time,

Andy Swan
Co-Founder